Interactive Economics resources for high school students, teachers, and everyone else
Unit 4 Topic 2:
Economic Indicators and Past Budget Stances
On this page:
-
Real GDP growth, Underlying Inflation and Unemployment Rate 2015 - 2026 :: interactive data explorer
-
Australian GDP Growth 1999 - 2026 :: interactive data explorer and quiz
-
Australian Labour Market: Unemployment and Underutilisation 1999 - 2026 :: interactive data explorer and quiz
-
CPI and Trimmed Mean Inflation Data Australia 1999 - 2026 :: interactive data explorer and quiz
-
Real Wages Growth in the Australian economy :: interactive data explorer and quiz
-
Capacity Utilisation and the Output Gap in the Australian economy :: interactive data explorer and quiz
-
Phillips Curve - Inflation and Unemployment :: interactive economic model
-
Australian Fiscal Policy: Federal Budget Analysis 1999 - 2026 :: interactive data explorer and quiz
-
Australian Federal Government Debt: 1999 - 2026 analysis :: interactive data explorer and quiz
-
Reserve Bank of Australia Cash Rate Monetary Policy 1999 - 2026 :: interactive data explorer and quiz
-
Subject matter for Unit 4 Topic 2: Economic Indicators and Past Budget Stances
Unit 4 Topic 2: study and summary guides
Gross Domestic Product Growth in the Australian economy
GDP Growth: Measuring the Economy's Performance
Gross Domestic Product (GDP) measures the total value of all goods and services an economy produces. GDP growth rate is probably the single most important indicator of economic performance, showing whether output is expanding, stalling, or contracting.
The rate matters because growth underpins living standards. When GDP expands, businesses invest, employment rises, and incomes tend to grow. When growth begins to slow - and sometimes becomes negative - the consequences reverse: unemployment rises, inflation falls and household living standards decline. This is why both the Government and the Reserve Bank monitor the figure closely.
The interactive below traces Australia's GDP growth since 1999, allowing you to examine the periods of expansion, the major economic shocks, and the downturns that have shaped the economy.
Labour Underutilisation in the Australian economy
Unemployment and Underutilisation: Measuring Spare Capacity
The unemployment rate is one of the most closely watched economic indicators, measuring the proportion of people actively seeking work but unable to find it. Yet on its own it tells only part of the story. The underutilisation rate adds a second, often overlooked group — the underemployed: part-time workers who want and are available for more hours.
Together, these measures reveal how much of the nation's labour is going unused — and unused labour represents lost potential output, meaning goods, services, and incomes that could have been produced are forgone. As both rates fall, spare capacity disappears and the economy nears its productive limit. Economists estimate this limit using the NAIRU — the level of unemployment below which wage and price pressures begin to build.
Use the interactive below to trace both rates since 1999, and switch on the NAIRU overlay in the Explore tab to see when the labour market has run hot or cold.
Consumer Price Inflation in the Australian economy
Inflation: Tracking the Cost of Living
Inflation measures the rate at which the general price level rises over time, eroding the purchasing power of money. In Australia it is captured by the Consumer Price Index (CPI), which tracks the cost of a representative basket of goods and services.
The headline CPI includes every item in that basket — but this makes it volatile, as one-off swings in prices like fuel or fresh food can distort the underlying trend. To see through this noise, economists use the trimmed mean, which removes the most extreme price movements each quarter to reveal the persistent, broad-based rate of inflation. This is the Reserve Bank's preferred measure, because it better reflects the sustained inflationary pressure that monetary policy is designed to manage — and it is what guides the RBA's decisions on interest rates.
Use the interactive below to trace both measures since 1999, and switch on the RBA target band to see when inflation has sat within the 2–3% goal.
Real Wages Growth in the Australian economy
Real Wages: Are We Actually Getting Ahead?
It's easy to assume that a pay rise automatically means you're better off. But that's only true if your wages are climbing faster than prices. This is the difference between nominal wages — the dollar figure on your payslip — and real wages, which measure what that pay can actually buy once inflation is taken into account.
The distinction matters enormously. When real wages are rising, households can afford more than they could before, and living standards improve. But when real wages fall — when prices outpace pay — the opposite happens: every dollar stretches less far, and people's standard of living is quietly eroded, even as their wages keep rising in dollar terms. Australia saw exactly this during the 2022–23 cost-of-living crisis.
Use the interactive below to explore how Australian wages have measured up against prices since 1999 — and to see for yourself when workers were genuinely getting ahead, and when they were falling behind.
Capacity Utilisation and the Output Gap in the Australian economy
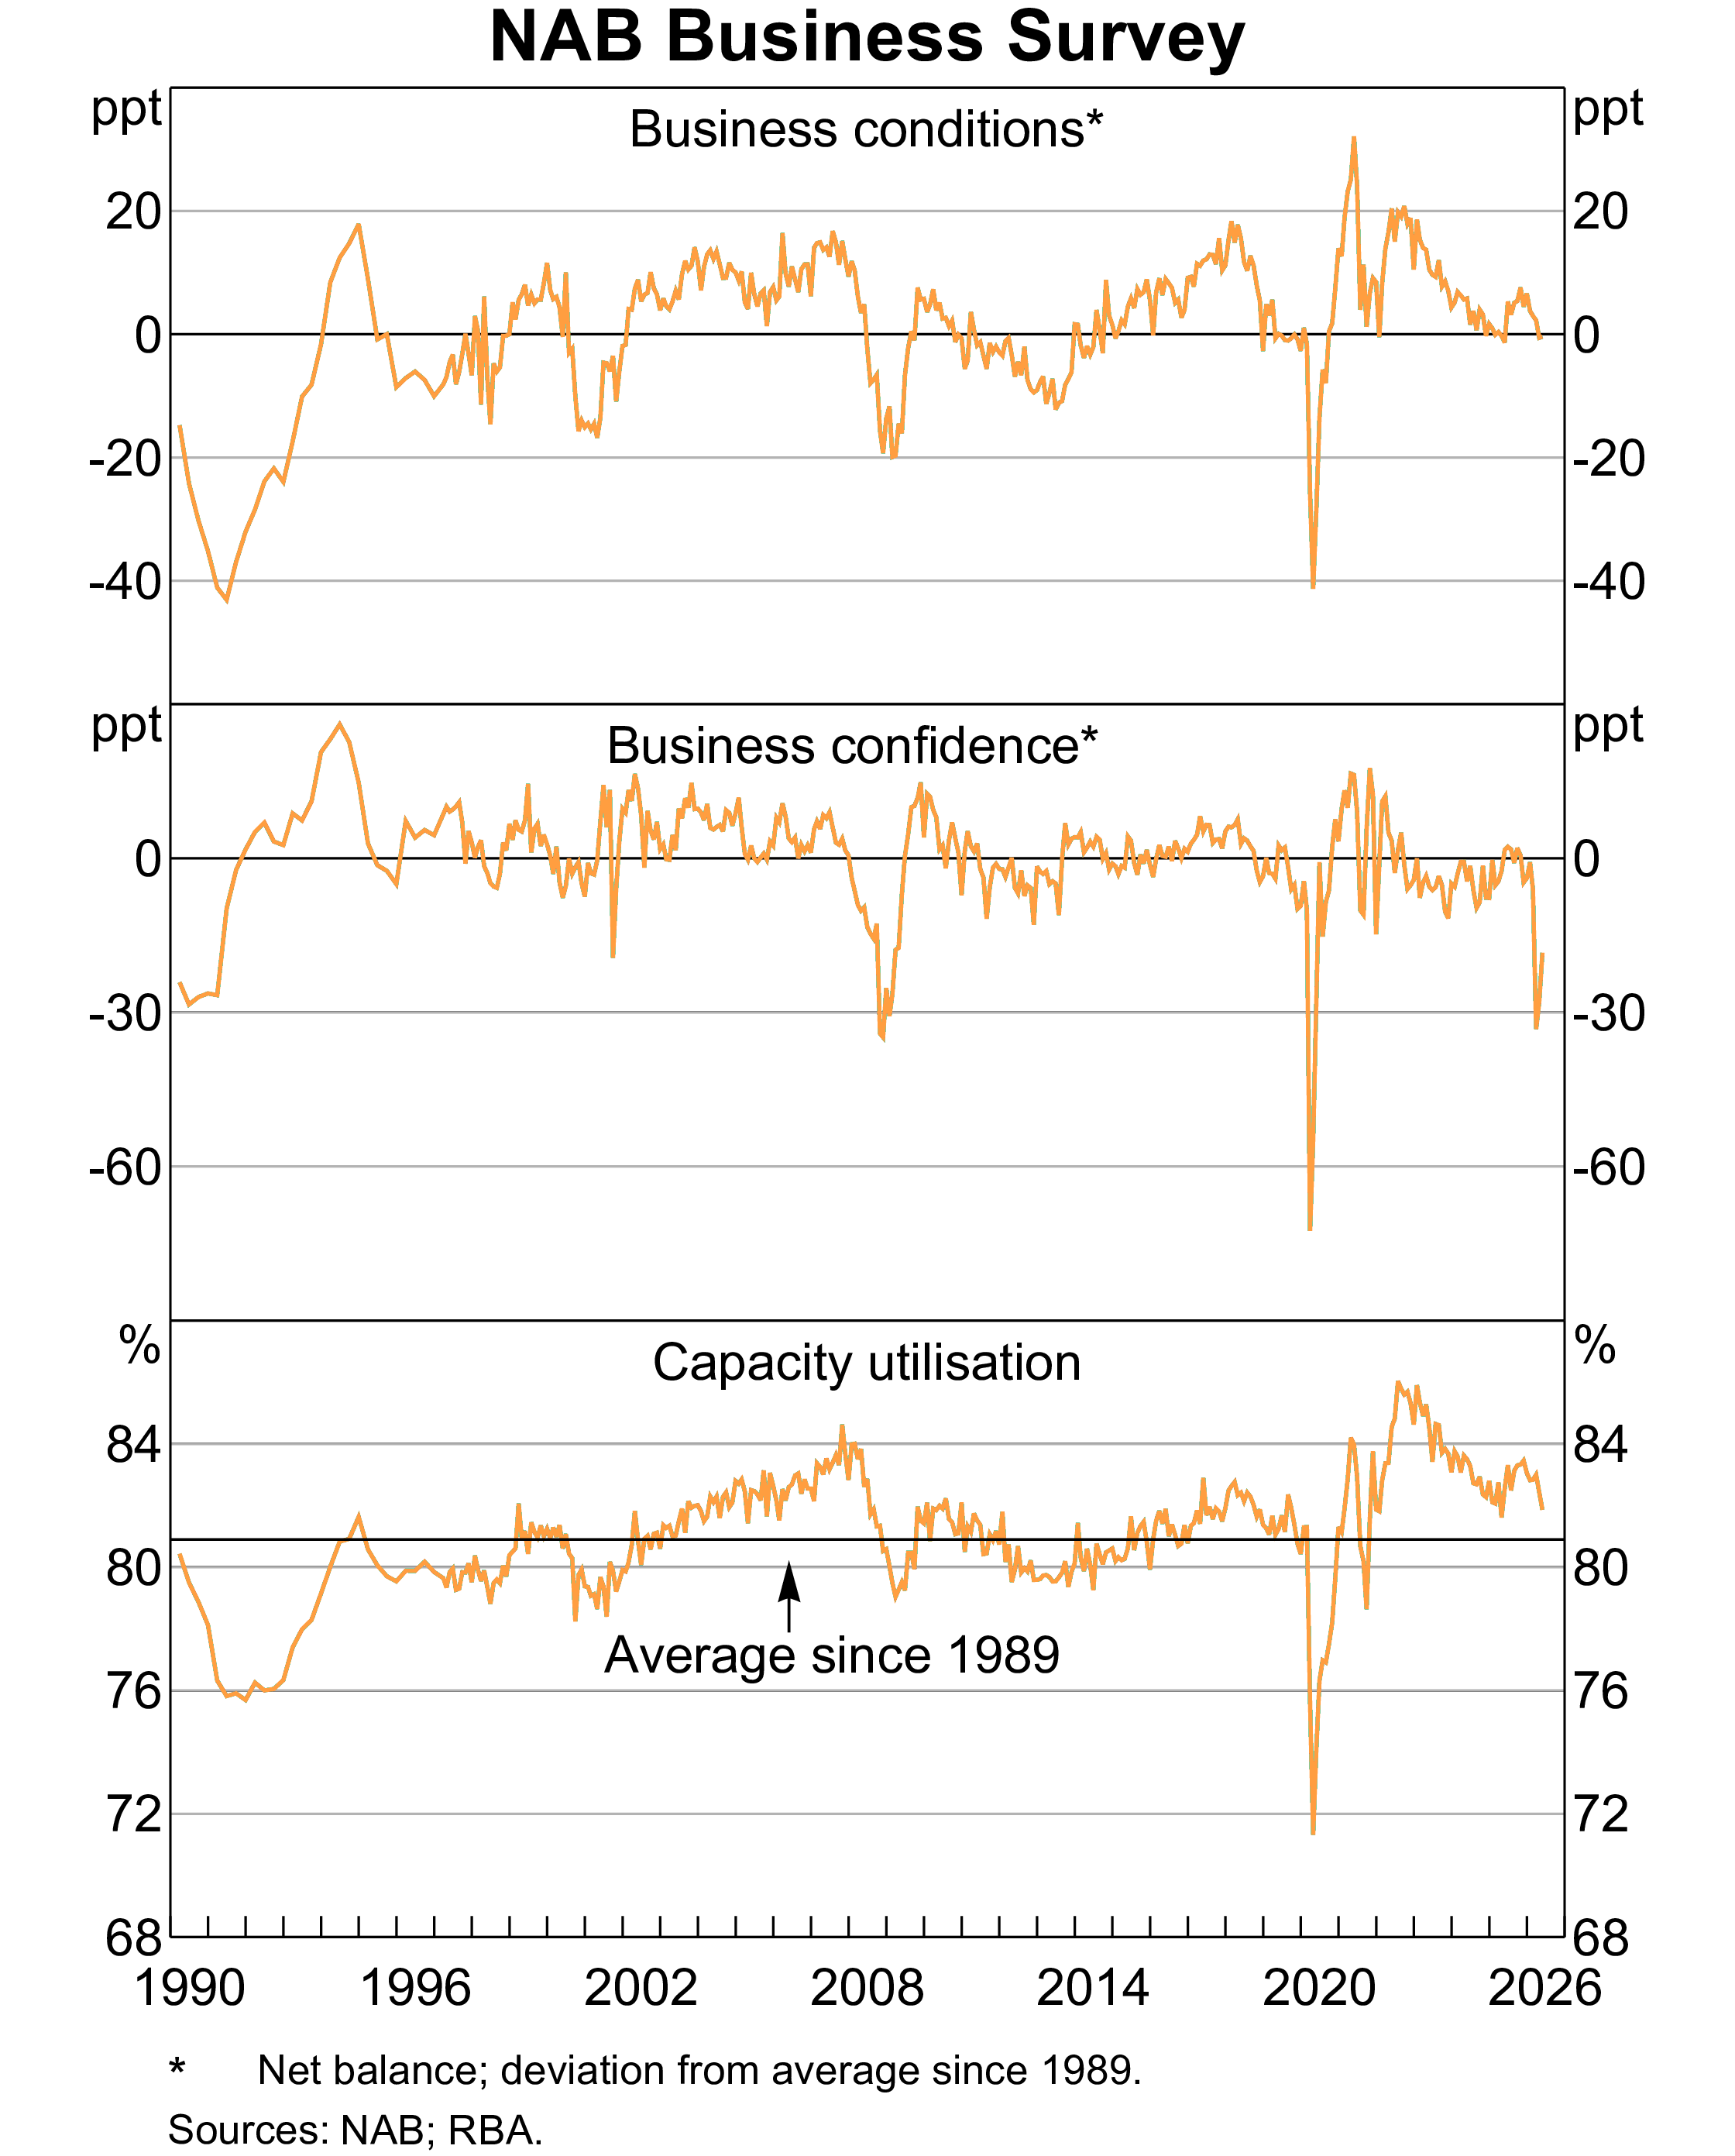
Capacity utilisation tells us how intensively firms are using their available productive capacity — their plant, equipment, and workers — so a reading above its long-run average signals the economy is running hot with little spare capacity (a positive output gap and building inflation pressure), while a reading below signals idle resources and slack (a negative output gap).
So we can then determine about the actual output of our economy compared to our potential output. We can also now visualise output location as it might appear on our production possibilities curve.
The long-run average capacity utilisation in the Australian economy sits at about 81%.
The interactive below can overlay:
-
trimmed mean inflation - notice how inflation tends to peak after peak in capacity.
-
unemployment - the gap between the unemployment rate to the NAIRU.
Phillips Curve :: interactive model
How to use the interactive model
-
use the sliders (or drag curves) to shift the Short-Run Phillips Curve (SRPC) and the Long-Run Phillips Curve (LRPC)
-
use the sliders or drag the dot to investigate the relationship between inflation and unemployment
Australian Fiscal Policy :: Federal Budget analysis 1999 - 2026
Australian Federal Government Debt :: 1999 - 2026 analysis
Subject matter
Topic 2: Economic Indicators and Past Budget Stances
In Topic 2, students apply their knowledge of economic indicators and theory to analyse and evaluate past economic events and decisions made in the annual federal budget of the government of the day.
-
Explain and categorise economic indicators of past economic performance, including leading, lagging, and coincident indicators, using current data from objective sources, e.g. the Australian Bureau of Statistics and the Reserve Bank of Australia.
-
Calculate the rate and changes of economic data, including real economic growth, inflation, the rate of unemployment, and the participation rate.
-
Select data and information to analyse and evaluate
-
past economic indicators, to assess the position of the Australian economy on the economic cycle at previous points in time
-
the relationship between the economic cycle and economic objectives using past economic indicators and trade-offs, including conflicting objectives, intertemporal relationships, and the short- and long-run Phillips curve.
-
-
Select data and information to analyse and evaluate
-
the accuracy, reliability and efficacy of common indicators used to measure economic objectives in a past scenario
-
recent Australian federal budget outcomes including cyclical and structural causes and effects of expansionary and contractionary fiscal policy stances within the last 3–10 years
-
the Australian Government’s economic management and achievement of its macroeconomic objectives for a period within the last 3–10 years.
-
-
Create responses that communicate economic meaning using data, information and diagrams to suit the intended purpose in paragraphs and extended responses that form an analytical essay format.
Reproduced from Queensland Curriculum and Assessment Authority, Economics 2025 v1.2 General senior syllabus October 2024
Internal Assessment 3
Extended Response to Stimulus: Exam Specifications
Assessment objectives
Specifications
The teacher provides an examination that:
-
-
Comprehend features and economic concepts, principles and models of macroeconomic objectives, theories, economic indicators and budget stances.
-
Analyse an economic issue that involves economic indicators and budget stances .
-
Evaluate an economic outcome relevant to economic indicators and budget stances.
-
Create a response that communicates economic meaning to suit the intended purpose in an analytical essay.
-
relates to Unit 4 Topic 1 and Unit 4 Topic 2
-
is focused on a contemporary economic issue that is of national, state and/or regional significance to Australia
-
requires an analytical essay in response to an unseen question with seen and unseen stimulus
-
allows students to choose two economic criteria for their evaluation
-
must elicit a variety of possible responses.
-
-
Stimulus specifications
-
The teacher provides seen and unseen stimulus that:
-
enables a selection of current, accurate and relevant data and information from a variety of sources, e.g. government and other institutional websites, published reports, media articles and expert commentaries
-
is a minimum of nine sources that include data and information in visual and written forms that fit on both sides of four A4-size pages or equivalent
-
facilitates both the analysis and evaluation components of the task
-
allows for unique responses.
The teacher provides unseen stimulus that:
-
fits on both sides of one A4 page or equivalent
-
is succinct enough for students to engage with during planning time
-
includes information that is critical to the item, so that students cannot write pre -prepared
responses or predict the focus of the unseen question.
-
Reproduced from Queensland Curriculum and Assessment Authority, Economics 2025 v1.2 General senior syllabus October 2024